Healthcare practices in 2026 are buying software differently. Instead of sifting through endless feature lists, they now demand proof that systems save time, secure revenue, and simplify care delivery. Concurrently, adoption is highly uneven: smaller practices and a handful of states drive most of the activity, while enterprises and long-tail regions remain underrepresented.
This report draws on 36,000+ buyer-vendor interactions to trace how a narrow set of workflow features shapes decisions, where adoption is most concentrated, which vendors are setting benchmarks, and where coverage gaps leave specialties underserved.
But the story does not end with data snapshots. Strategic growth pathways are emerging: vendors must pivot from feature parity to outcome proof, from isolated deployments to integrated ecosystems, and from rigid contracts to adaptive pricing and adjacent market plays.
All insights in this report are drawn from Software Finder’s proprietary dataset of buyer–vendor interactions between Q4 2024 and Q4 2025. Findings represent directional patterns observed within this period and should be interpreted as indicators of market behavior, not absolute truths.

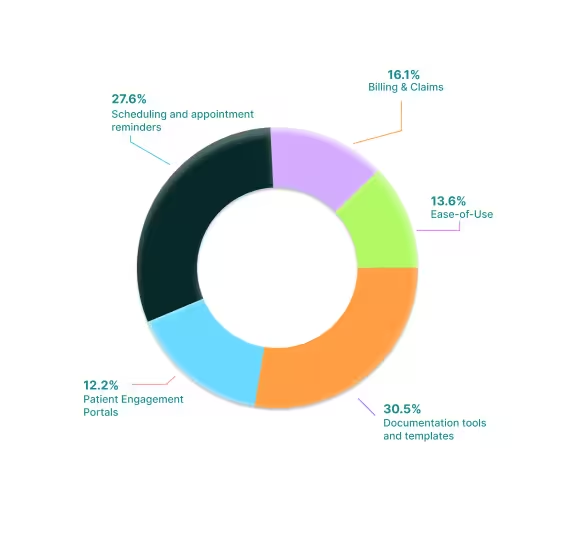
- Three features drive most buying decisions. Documentation speed, scheduling efficiency, and billing integrity explain nearly three-quarters of demand. Ease-of-use and patient portals matter more as tie-breakers than shortlist drivers.
- Adoption is concentrated but uneven. SMBs account for the bulk of activity, while enterprise adoption remains limited by longer evaluation cycles. Four states (Florida, Texas, California, New York) dominate momentum, with mid-tier states emerging as growth markets.
- The vendor landscape is split. Athenahealth leads consistently across sizes and specialties, while challengers like Modernizing Medicine, Nextech, Ensora, and ADS defend niches. Breadth versus specialty-depth defines today's competitive market.
- Whitespace is significant. Gastroenterology, sleep medicine, CHCs, and house calls remain underserved, alongside adjacencies like IVF, sports medicine, and nephrology. Vendors who gain first-mover advantage can build defensible leadership.
- Growth requires a strategic pivot. The next cycle of winners will compete on outcomes, streamline onboarding and integrations, adapt revenue models, and expand into adjacencies. Interoperability, payer connectivity, ambient documentation, and cybersecurity readiness are becoming deal-clinching differentiators.
This report is based on Software Finder’s proprietary dataset of buyer–vendor interactions collected between Q4 2024 and Q4 2025. The dataset reflects:
- Shortlist requests, RFP submissions, and vendor comparisons initiated by healthcare practices across the U.S.
- Post-evaluation feedback from buyers on feature priorities, adoption hurdles, and reasons for vendor selection or rejection.
- Observed adoption outcomes across practice sizes, specialties, and geographies.
All data was deduplicated at the practice level, ensuring that each organization is counted once at its most advanced stage of evaluation. Features and pain points were tagged into five standardized categories: documentation, scheduling, billing/RCM, ease-of-use, and patient portals. Vendor adoption was mapped by specialty and practice size to create comparative matrices.
Unlike survey-driven reports, this analysis is grounded in evaluation behavior, offering a more accurate view of purchase dynamics.
Data & Interpretation Note
While the dataset captures an extensive sample size of real-world medical software buying behavior, the findings reflect directional trends rather than definitive market rankings. Insights are based on observed interactions within the defined timeframe and may evolve as buyer priorities, vendor strategies, and regulations shift.
In 2026, three features explain nearly three-quarters of all buyer demand: documentation, scheduling, and billing/RCM.
Documentation leads the field because clinical flow depends on how seamlessly visits are documented and closed. Buyers consistently judge systems by whether appointments can be documented and closed the same day. Scheduling and reminders, the second-ranked priority, drive shortlist entry by reducing no-shows and redistributing staff effort. Billing and RCM, while third overall, carry more weight in late-stage evaluations. Vendors that prove payer performance, higher first-pass acceptance, lower denial rates, faster days-to-cash, often tip the final decision in their favor.
Ease-of-use and patient portals are rising as decision-bearing factors but remain secondary. They rarely displace the top three, functioning more as tie-breakers in smaller practices where staff resources are thin in numbers or patient loyalty is at risk.

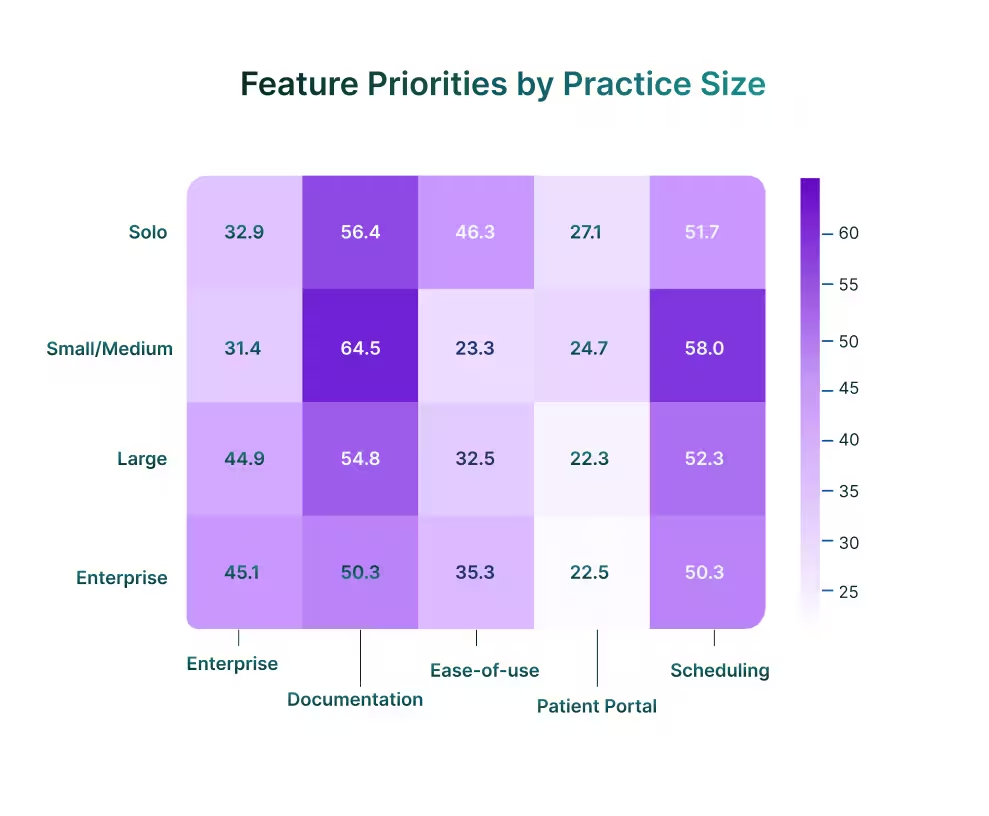
By Practice Size
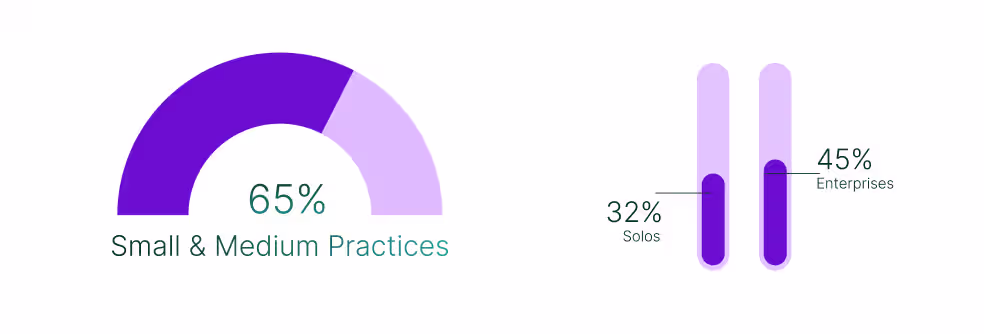
Documentation is the constant anchor, topping every segment and peaking at nearly 65% in small and medium practices. As medical organizations scale, billing and claims rise to near-parity with documentation, 45% in enterprises versus only 32% in solos, reflecting the greater revenue exposure of multi-payer groups.
Ease-of-use stands out as the defining solo-practice concern. Nearly half of solo buyers cite it as a top priority, double the enterprise rate. Without IT support, solo practitioners simply cannot absorb systems with steep training curves.
Scheduling and reminders skew higher in large practices, where a one-point reduction in no-shows equates to meaningful revenue. Patient portals remain secondary everywhere but trend higher among solos, where retaining patients in competitive markets depends on communication access.
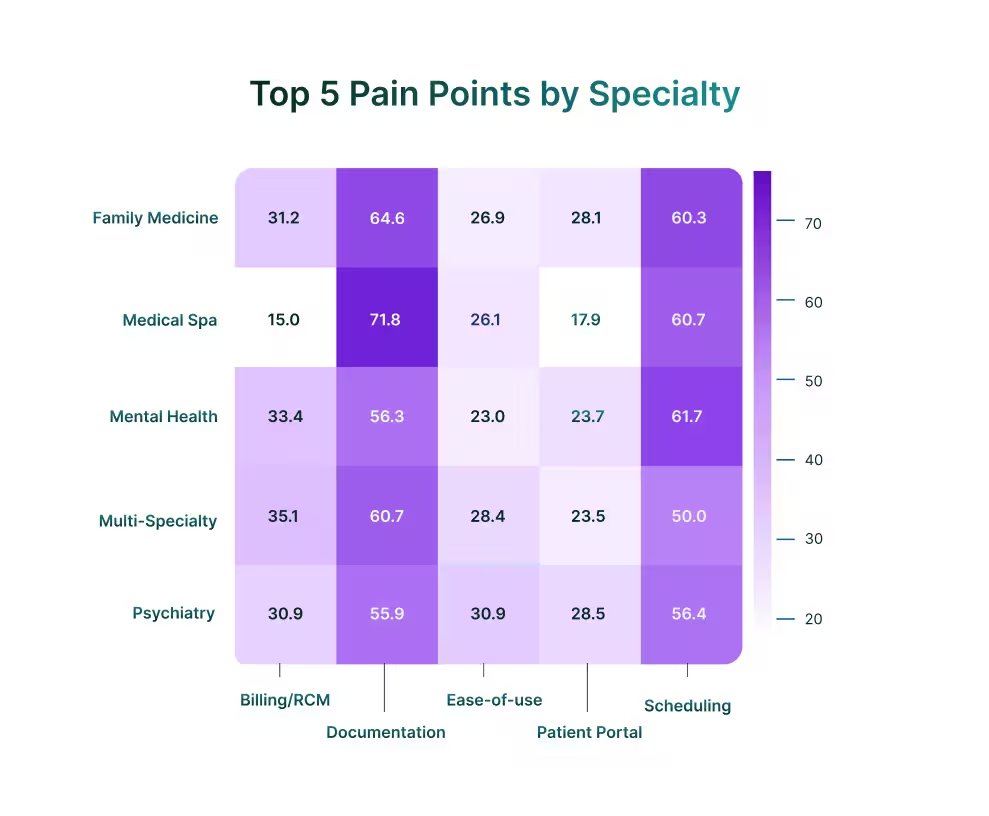
By Specialty
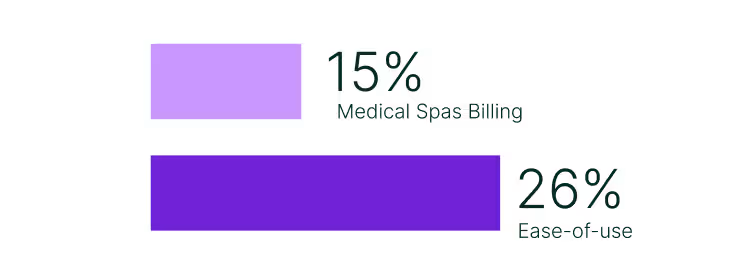
Across specialties, documentation and scheduling dominate, but the way buyers weight the rest of their priorities reveals very different operational pressures. Medical spas, for example, place little emphasis on billing (15%), instead prioritize ease-of-use (26%), enabling staff to move quickly through high patient volumes without specialized training.
In contrast, family medicine and mental health place billing at the center, with roughly one-third of all cited pain points tied to RCM. For these payer-heavy fields, revenue cycle stability is the safeguard against denials and reimbursement delays that ultimately determine financial viability.
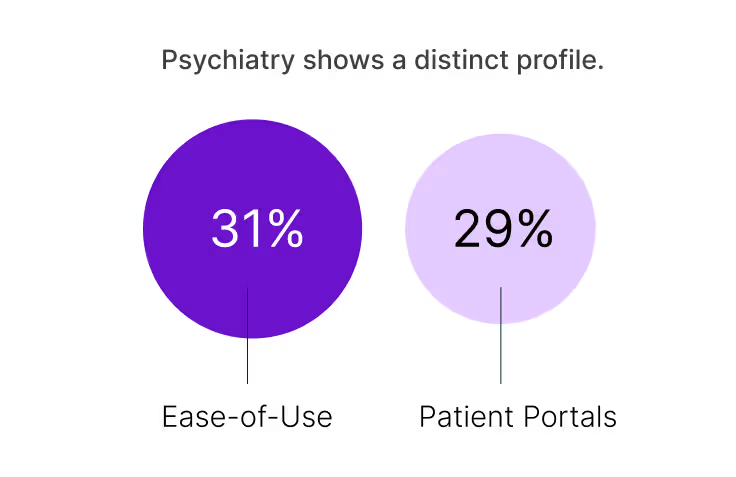
Psychiatry shows a distinct profile. Ease-of-use (31%) and patient portals (29%) weigh more heavily here than in most other specialties, reflecting workflows where physicians document directly and long-term patient engagement is central to outcomes. Multi-specialty groups track closely to the overall market pattern, anchored by documentation and scheduling, with moderate demand for billing and portals.
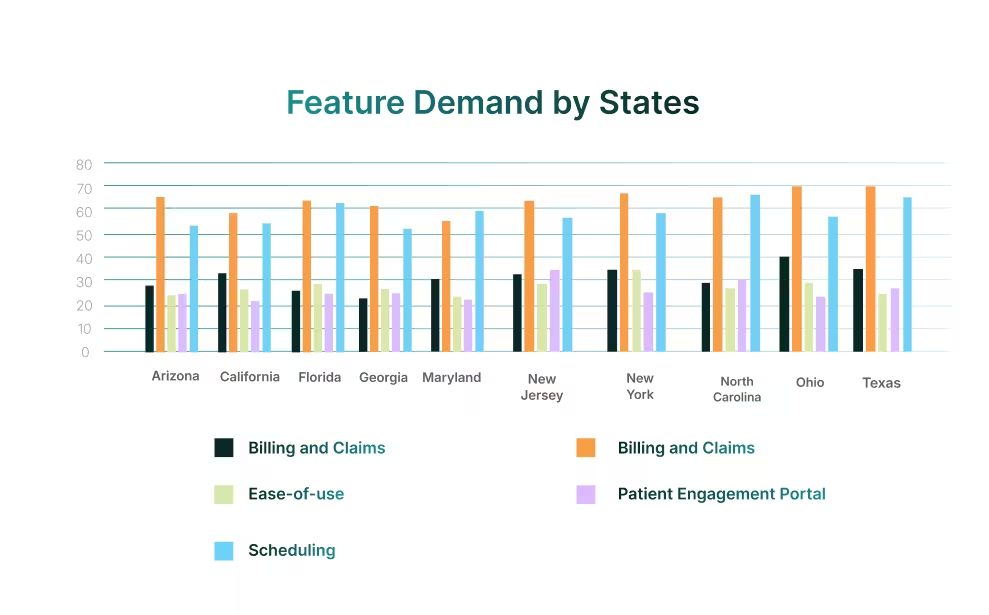
By Geography
State-level patterns state the same: documentation is the baseline, and scheduling is the next driver. Where the market diverges is in how buyers weigh billing, ease-of-use, and patient engagement relative to these core functions.
Billing and RCM carry exceptional weight In Ohio, California, New York, and Texas, driven by complex payer ecosystems and reimbursement challenges. By contrast, New Jersey and North Carolina reflect an engagement-led profile, where adoption depends on user experience and communication. Meanwhile, scheduling itself peaks in Florida and Maryland, consistent with high-volume operations, where attendance directly drives revenue.
“Documenting routine practices is essential for the continuity of patient care, legal defence, reimbursement, communication among healthcare professionals and better patient diagnoses and treatments.” PMC, 2023
Adoption is not spread evenly across the market. Activity is concentrated in smaller practices, where speed and simplicity drive decisions, and in a limited set of states that carry disproportionate weight. Larger groups and many regions remain underrepresented, highlighting both the current centers of gravity and the markets still underserved.
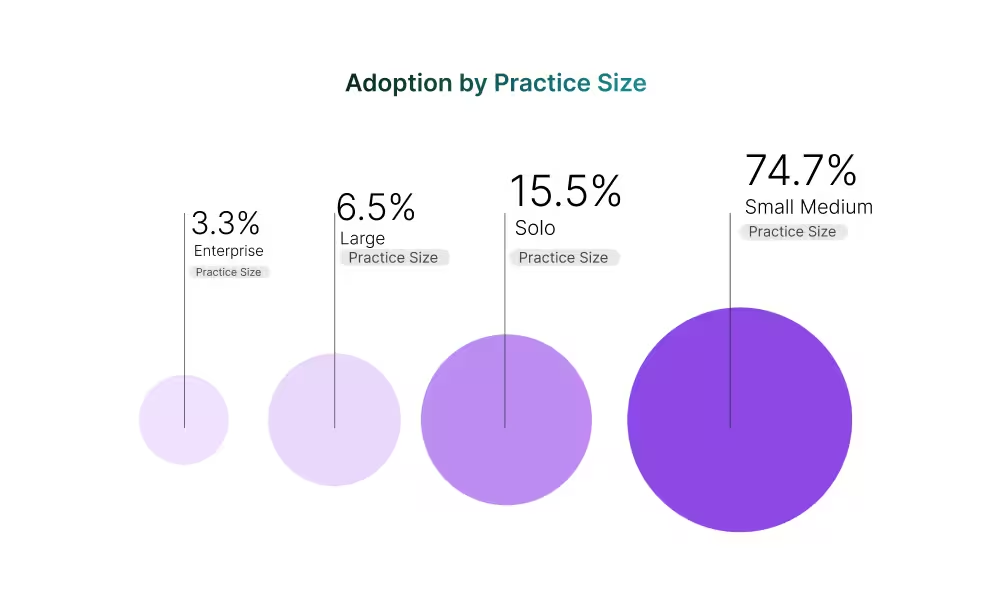
By Practice Size
The weight of adoption today sits overwhelmingly with small and medium practices, which account for nearly three-quarters of all observed activity. Their priority is clear: systems that shorten documentation and streamline scheduling without heavy implementation overhead. Solo clinics, at just over 15%, show a different dynamic. For these providers, ease-of-use and quick setup outweigh advanced functionality, reflecting the reality of limited staff and IT support.
Large and enterprise groups together make up barely one in ten adoptions. Their slower uptake is less about interest and more about the higher bar they set. These organizations look for requirements, proof of billing integrity, audit controls, and governance at scale, that extend the evaluation cycle and narrow the field of acceptable vendors.
This size distribution points to two truths: the growth engine today is firmly in smaller practices, but the strategic battleground for vendors lies in meeting enterprise-grade expectations, where even modest gains can shift large volumes of patients and revenue.
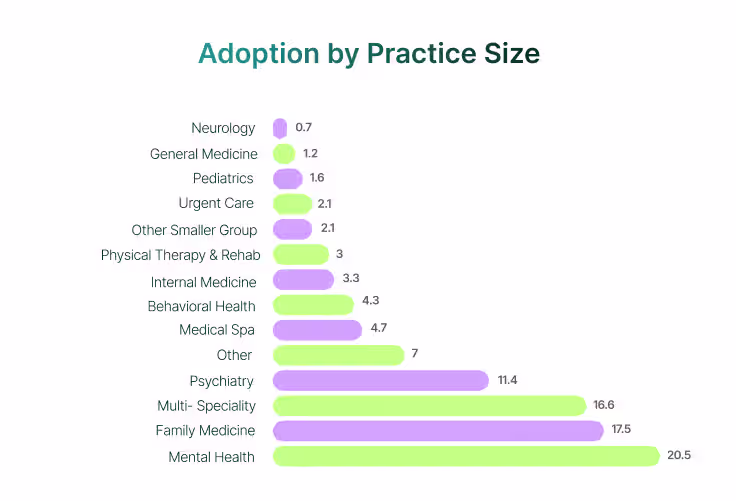
By Specialty
The gravity of medical software adoption sits firmly in a handful of specialties. Family medicine, psychiatry, mental health, and multi-specialty practices pull in the majority of observed conversions, reflecting both their broad patient bases and payer complexity.
A mid-tier of specialties, such as medical spas, behavioral health, and internal medicine, represents steady but smaller pipelines. These areas are large enough to sustain dedicated plays yet too small to reshape market structure alone.
Our analysis shows that beyond this, adoption thins out across numerous fields like gastroenterology, occupational medicine, nephrology, and other niche lines. While individually small, together they signal untapped demand that has yet to find a consistent vendor match.
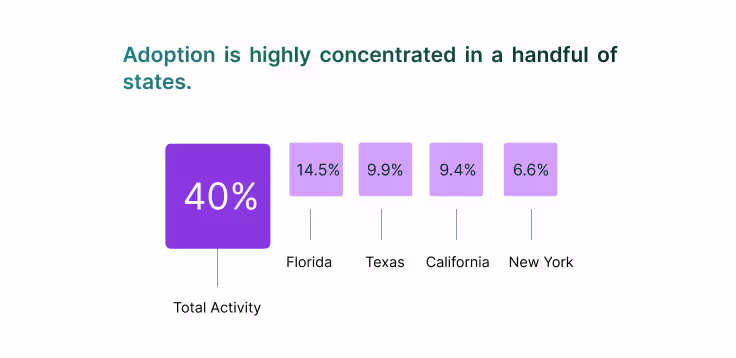
By Geography
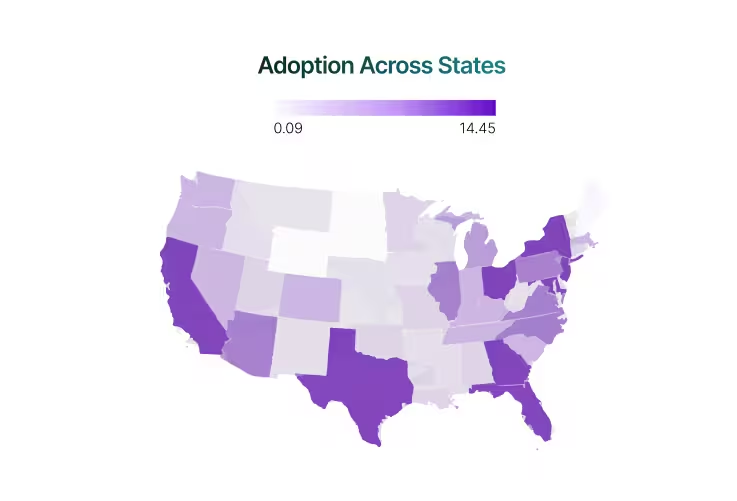
Adoption is highly concentrated in a handful of states. Florida (14.5%), Texas (9.9%), California (9.4%), and New York (6.6%) together represent more than 40% of total activity, highlighting how much momentum is anchored in large, diverse healthcare ecosystems. Vendors winning in these states are securing both volume and visibility, but also facing sharper competition.
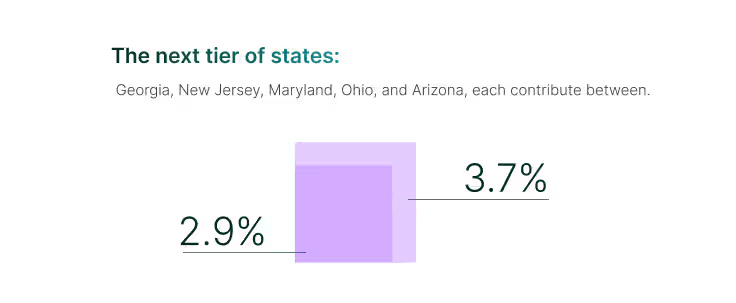
The next tier of states: Georgia, New Jersey, Maryland, Ohio, and Arizona, each contribute between 2.9% and 3.7%. While smaller in absolute share, this cluster signals emerging opportunity markets. Their combined weight is meaningful, and targeted enablement here could shift them from trailing contributors into consistent drivers of growth.
Most other states remain in lower percentages or bundled into “Other” (19.2%), which highlights both risk and potential. On one hand, adoption is still fragmented outside of the top tier; on the other, the under-penetration suggests significant white space. Vendors that can bring localized payer integration, faster implementation, and state-specific compliance proof stand to capture share where inertia currently holds adoption back.
Sleeper State
Sleeper states are markets where adoption potential outpaces current performance: states that either generate strong inquiry volumes but convert below expectation, or smaller regions that quietly outperform the national average. These states often signal early or under-recognized opportunities where focused vendor strategies can unlock disproportionate growth.
Florida drives the largest volume of adoptions (14.5%), but with conversion rates far below the 21% national benchmark, the state reflects opportunity as much as it does risk. The state’s healthcare ecosystem is highly engaged, but high inquiry volumes are not converting at proportional rates. Vendors that can shorten evaluation cycles, improve funnel conversion, and align with local payer and regulatory dynamics could unlock the biggest near-term upside in U.S. medical software.
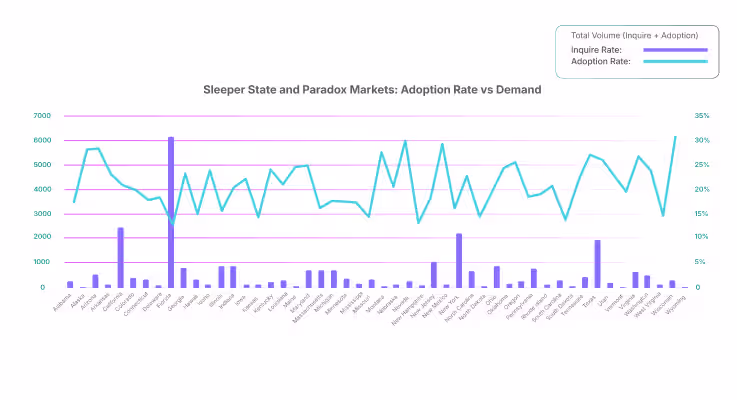
Beyond Florida, roughly one-third of states outperform the national average adoption rate, splitting into two distinct groups:
- High-volume outperformers: Texas, Georgia, North Carolina, Arizona, and Maryland not only attract meaningful inquiry traffic but also convert above the benchmark. These are second-wave growth engines where vendors should defend share and expand depth before competition strengthens.
- Small-state outperformers: Markets like Wyoming, Nevada, New Mexico, Alaska, Montana, Vermont, Maine, West Virginia, Idaho, and Arkansas show adoption rates well above the national baseline despite their small populations. These geographies offer efficient entry points and quick wins with lower competitive noise.
The competitive landscape in medical software is dual in nature: dominated by a few platforms in hospitals and far more varied in ambulatory care. Epic, Cerner, and Meditech anchor the oligoplistic hospital layer and set the interoperability expectations for rest of the market.
Ambulatory and specialty segments, however, remain far more dispersed. Here, adoption is driven less by regulatory lock-in and more by workflow fit, cost, and usability.
Our dataset captures this middle-market battleground, where vendors differentiate through performance in documentation, scheduling, and billing efficiency rather than monolithic enterprise integration.
Leader Matrix by Practice Size x Specialty
The leader matrix highlights the divide between vendors that scale across the board and those that dominate within defined niches.

|
Athenahealth emerges as the clear incumbent, appearing consistently across solo, SMB, large, and enterprise tiers in high-volume specialties such as family medicine, psychiatry, behavioral health, and multi-specialty care. This makes it the rare platform that grows with practices as they scale, providing continuity and compliance across diverse workflows. |

|
eClinicalWorks (eCW) holds one of the broadest footprints in ambulatory care with sustained presence across primary care, multi-specialty, and community health networks. Its broad client base and consistent retention across SMB and enterprise tiers reinforce its position as one of the leading platforms in U.S. outpatient care. |

|
Tebra, formed through the Kareo-PatientPop merger, maintains strong adoption in small and mid-sized practices, particularly in family medicine, mental health, and pediatrics. Its unified practice-management and engagement setup appeals to providers who prioritize straightforward operations. |

|
Modernizing Medicine (ModMed) stands out in OB/GYN, dermatology, ophthalmology, and ENT, showing that specialty-focused platforms can scale effectively when supported by solid operational capabilities. |
Specialty-focused challengers, however, continue to carve out defensible and fast-growing territory:
 | Nextech and Aesthetics Pro lead decisively in medical spas, a category where no competitor reliably challenges them. |
| | Ensora dominates behavioral health, including ABA, rehab, and speech therapy, proving that tailored therapy-first workflows can outcompete broader systems. |
| | NextGen Enterprise and Advanced Data Systems (ADS)appear disproportionately in enterprise-heavy lines such as ophthalmology, allergy, ENT, and occupational medicine, highlighting their strength in compliance-driven settings. |
 | AdvancedMD and RXNT remain strong among solo and SMB practices, especially where affordability and billing/RCM are top of mind. |
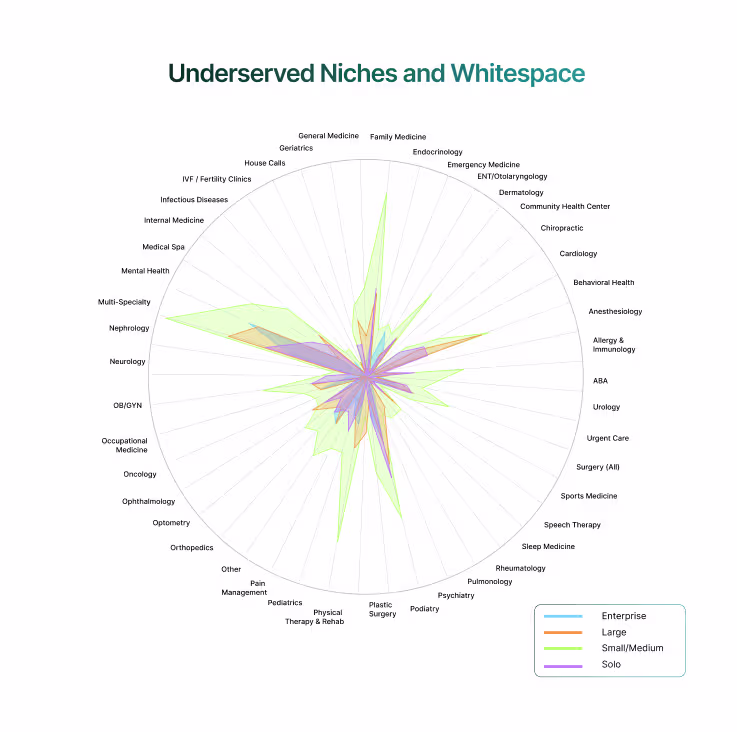
While established vendors dominate high-volume specialties, the dataset also exposes specialties where buyer demand consistently exceeds vendor coverage. These are not marginal markets and represent real opportunities for first movers to establish durable leadership.
- Gastroenterology: Limited adoption despite strong inquiry signals. Practices are underserved by generalized platforms, leaving room for tailored EHR and RCM features.
- Sleep medicine: Sparse vendor presence, even as patient demand for sleep clinics grows. Custom modules for diagnostics, device integration, and follow-ups remain a gap.
- House calls/home health: Few solutions designed around mobile workflows, yet buyer pull is evident in vendor–buyer conversations.
- Community health centers (CHCs): Large segment with unique compliance and funding requirements, but with minimal tailored vendor solutions visible today.
- Emerging gaps: anesthesiology, sports medicine, IVF/fertility, nephrology, pulmonology, infectious diseases, and ENT also appear weakly covered, reflecting the same demand–supply mismatch.
These whitespaces reflect structural gaps in the market. Vendors that invest early in specialty-specific templates, billing rules, and patient engagement features can capture a first-mover advantage that generalist incumbents will struggle to replicate.
The next cycle of leadership will not be won by the widest feature checklist but by evidence of impact. Vendors that can quantify time savings, revenue protection, and patient outcomes will hold the advantage.
The landscape itself is shifting. Buyer demand is consolidating around a narrow set of workflow-critical features, adoption remains uneven across geographies and practice sizes, and the market is split between broad incumbents and deep specialists. Within this turbulence lie first-mover openings: underserved specialties such as gastroenterology and sleep medicine, adjacencies like IVF and corporate wellness, and structural gaps in community health.
At the same time, regulation is resetting the bar. Interoperability mandates, prior-auth automation deadlines, and heightened cybersecurity expectations are becoming deal-breakers. Vendors that make compliance and payer connectivity turnkey can turn regulatory readiness into a competitive weapon.
The path forward is clear. Simplify adoption, prove measurable value, and expand into adjacencies before incumbents react. Those who execute early will not only capture share but also set the operational standards against which the rest of the market is measured.