
Project managers need more than just task lists and boards; they need a clear, visual timeline of the entire project. Gantt charts are the perfect answer, offering a bird’s-eye view of task schedules, dependencies, and overall project progress. While Jira software excels in Agile methodologies, its native functionality does not include Gantt charts.
Luckily, several workarounds and integrations are available. Plugins such as Structure Gantt, BigGantt, and WBS Gantt-Chart can help you create and manage Gantt charts with Jira, providing a holistic view of your project’s journey. So, in this blog, we will walk you through a step-by-step process on how to create Gantt charts in Jira using various plugins.
In this section, we have explained how each plugin works in Jira with detailed steps:
1. Structure.Gantt

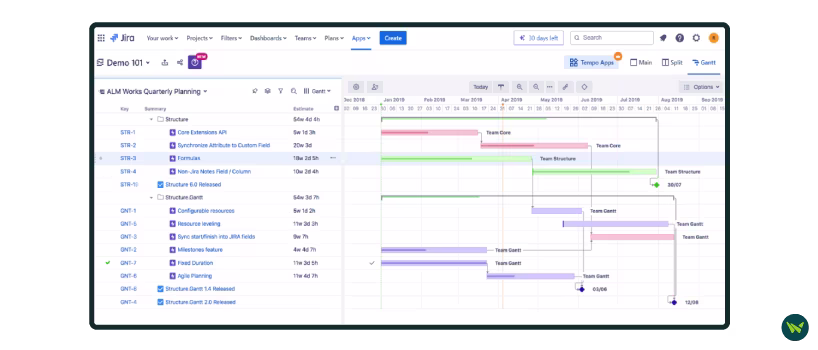
Structure.Gantt is a powerful Gantt chart add-on for Jira that enhances project management by seamlessly integrating with the existing Jira data. It allows users to create Agile Gantt charts that effectively visualize project timelines, dependencies, and resource allocation.
With its intuitive interface, Structure.Gantt enables teams to manage tasks within a hierarchical structure. Thus, making it easier to break down complex projects into manageable components. Here is a step-by-step guide to help you activate Structure.Gantt in Jira:
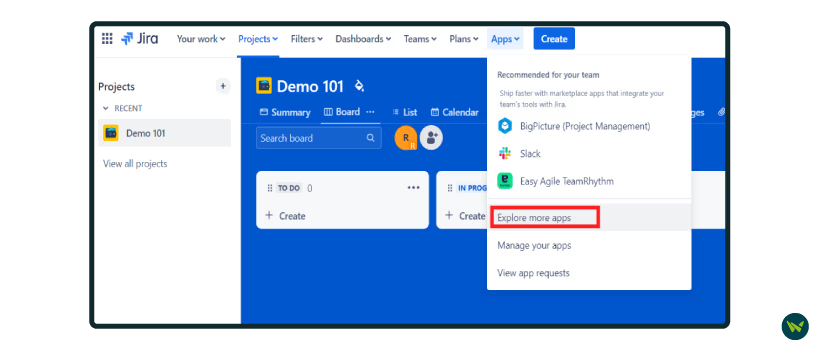
Step 1. Open your Jira dashboard and click on the ‘Apps’ button

Step 2. In the drop-down menu, choose the ‘Explore more apps’ option
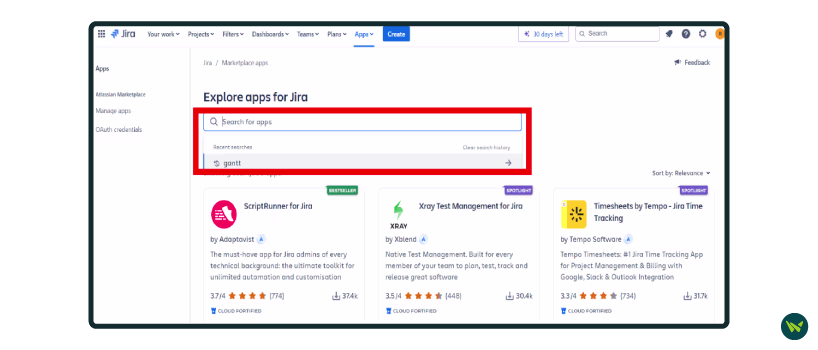
Step 3. This will open a search bar where you can type ‘Gantt’ or ‘Gantt charts’ under the ‘Explore apps for Jira’ section
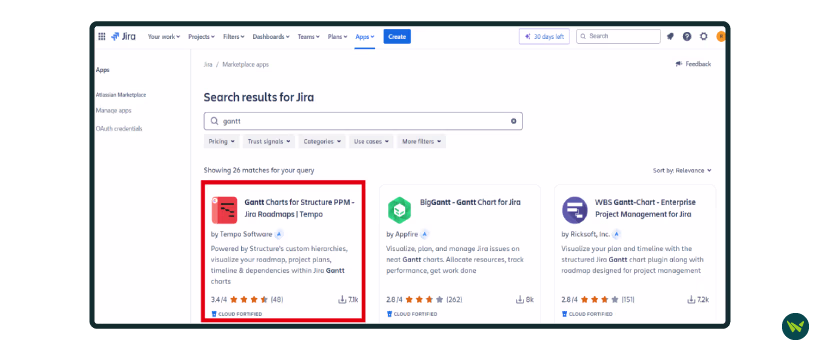
Step 4. Structure.Gantt may show up as ‘Gantt Charts for Structure PPM.’ Once it appears, select this chart by clicking on it.
Step 5. Afterwards, hit the ‘Try it free’ button on the right side to download it for free and start your trial.
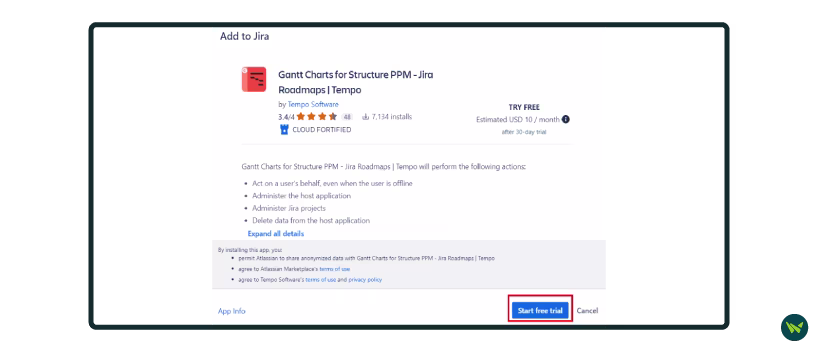
Step 6. Then, as the ‘Add to Jira’ pop-up window appears, press the button that says ‘Start free trial’
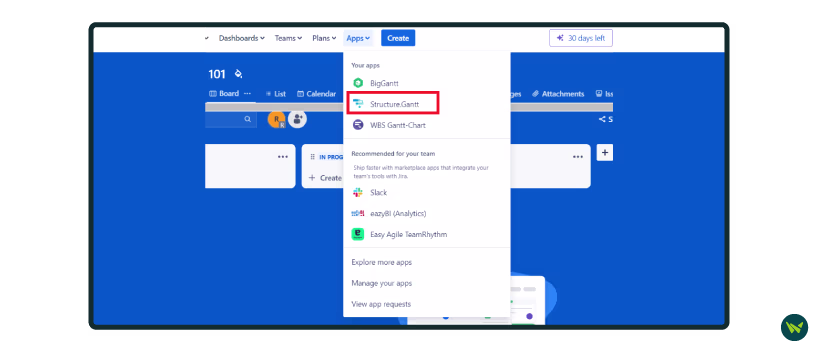
Step 7. After the plugin has been installed, go to the dashboard again and click on the ‘Apps’ button. Now, in the drop-down menu, click on ‘Structure.Gantt’ to launch it and access the Gantt chart view.
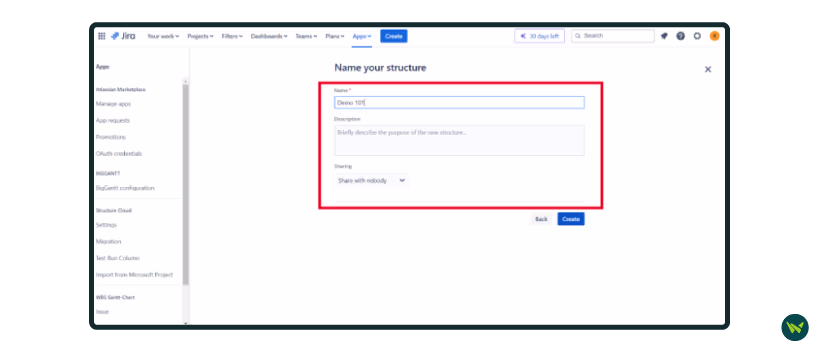
Step 8. Provide the necessary information under ‘Name your structure’ section, such as ‘Name,’ ‘Description,’ and ‘Sharing.’ At last, press the ‘Create’ button to get started.
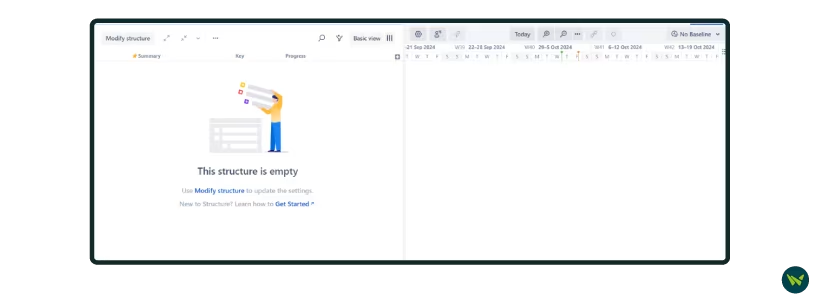
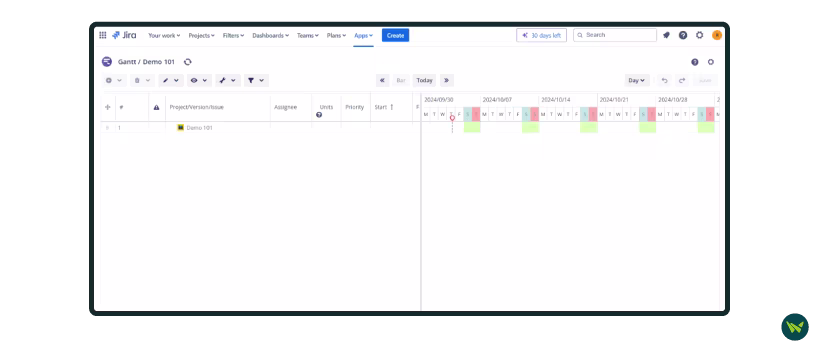
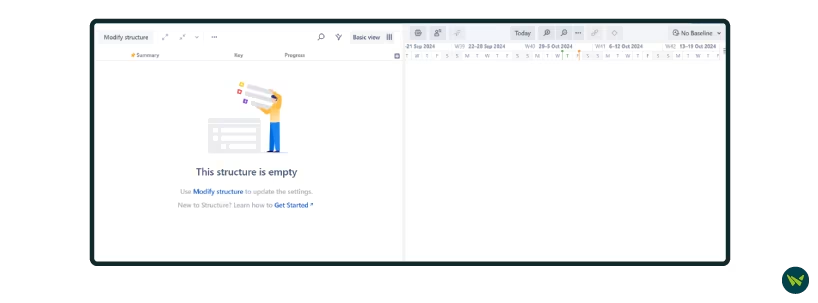
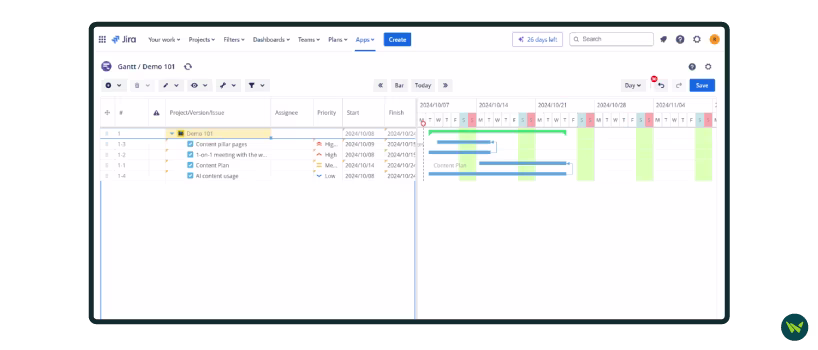
Step 9. Now, a new window will appear, when you will have complete access over the Gantt chart view.
Step 10. Adding data to your sheet will create a Gantt chart for your project, helping teams visualize their sequence of work and deadlines.
Benefits From Using Structure.Gantt
BigGantt

BigGantt is another excellent add-on for creating Gantt charts in Jira. This tool allows users to visualize, plan, and manage Jira issues through intuitive Gantt charts. This makes it easy for them to allocate resources, track performance, and manage project timelines.
The installation and setup process for BigGantt is similar to that of Structure.Gantt. Simply follow steps 1 to 6 outlined for Structure.Gantt. However, this time you must search for BigGantt using the search bar. Once you’ve completed those steps, you’ll be able to start using the plugin.
Step 1: From the main dashboard of Jira, open ‘Apps’ drop-down menu and click on ‘BigGantt’ plugin to open it.
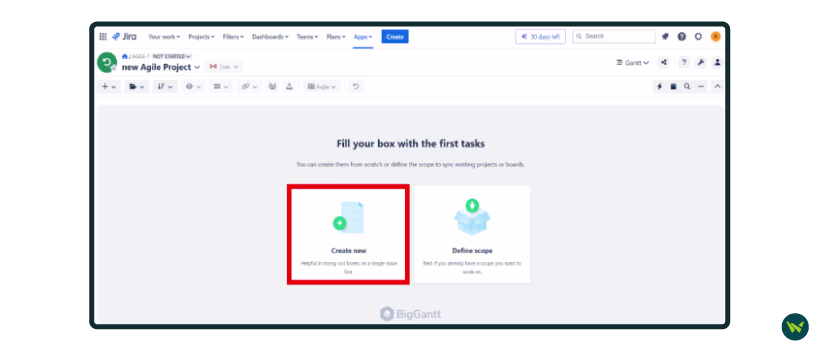
Step 2. After you have launched the BigGantt, press ‘Create new’ button.
Step 3. You will now have full access to the Gantt chart view.
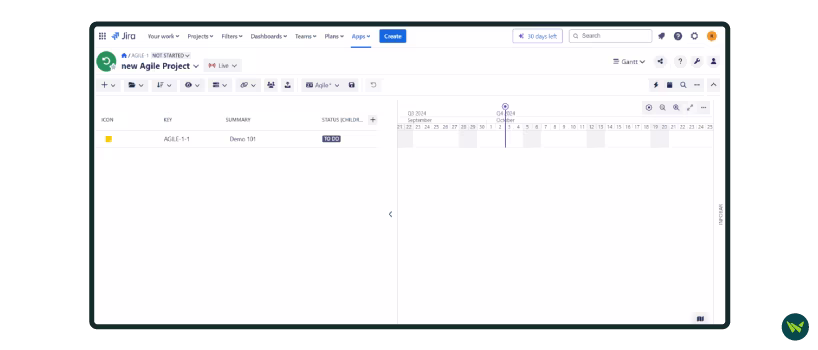
Step 4. Populate your chart with information on your project. You can add tasks to the Gantt chart by clicking on the ‘+’ icon and opening a drop-down menu.
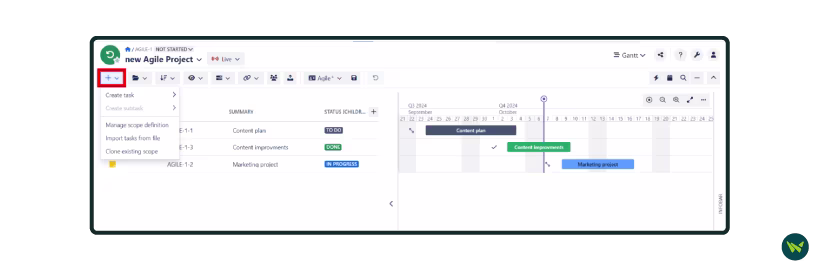
Step 5. Setting up a new task is extremely easy. Place your cursor on ‘Create task’ option to access the extended menu and choose the ‘Basic Task’ option.
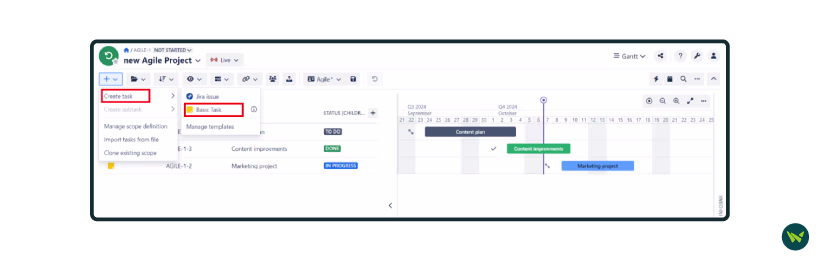
Step 6. You will be greeted with the ‘Create basic task’ pop-up. Fill the required information, such as ‘Summary,’ ‘Start date,’ and ‘End date.’ You can even set specific project milestones to serve as check posts in your project timeline by toggling the ‘Create as a milestone’ button.
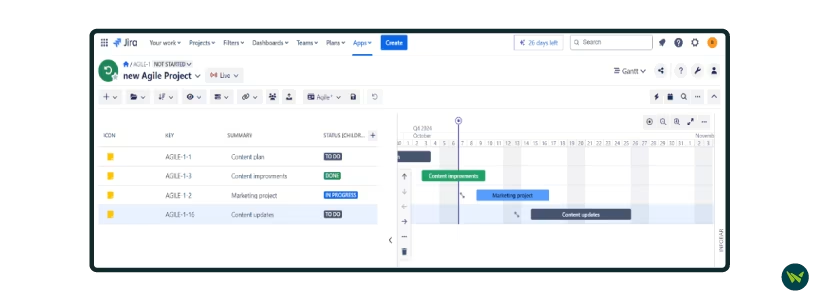
Step 7. As you add more tasks, you’ll be able to create an informative, visual board that offers keen insight into your project’s various stages
Benefits From Using BigGantt
WBS Gantt-Chart
WBS Gantt-Chart is a powerful project management tool that integrates seamlessly with Jira, enabling project managers to plan, track, and visualize their projects using Gantt charts. This tool provides a detailed breakdown of tasks through a Work Breakdown Structure (WBS), allowing teams to manage even the most complex projects effectively.
The setup process for WBS Gantt-Chart follows the same steps as Structure.Gantt and BigGantt up until Step 6, this time searching for ‘WBS Gantt-Chart.’ Once you’ve completed those initial steps, you can start using your plugin by following these steps:
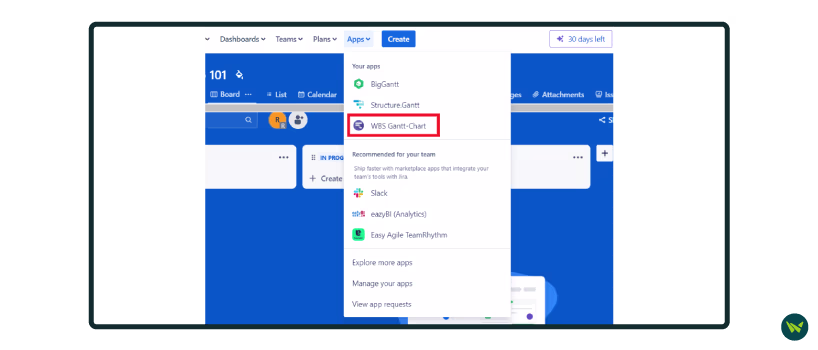
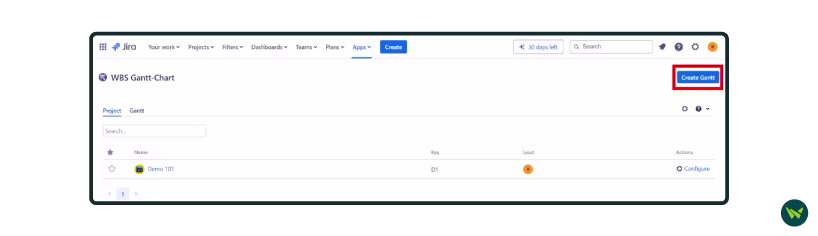
Step 1. From the main dashboard on Jira, access ‘Apps’ and click ‘WBS Gantt-Chart’ in the drop-down list.
Step 2. As the new window appears, click on ‘Create Gantt’ button on the top right side of the screen.
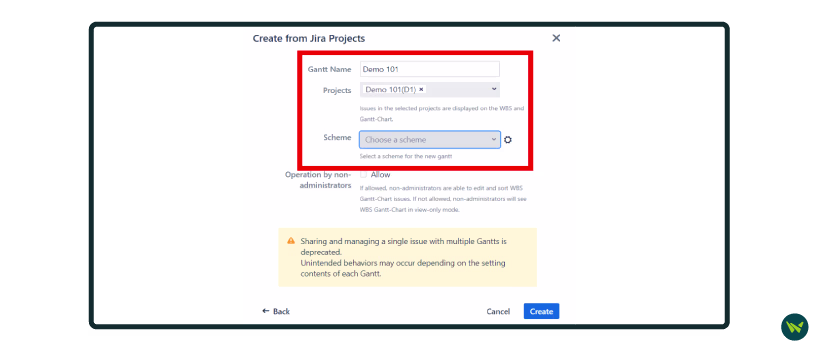
Step 3. Following this, choose ‘Create from Jira projects’ option within the ‘Create a Gantt Chart’ pop-up window.
Step 4. Input the required information like ‘Gantt Name,’ ‘Projects,’ and ‘Scheme.’ Now, press the ‘Create’ button.
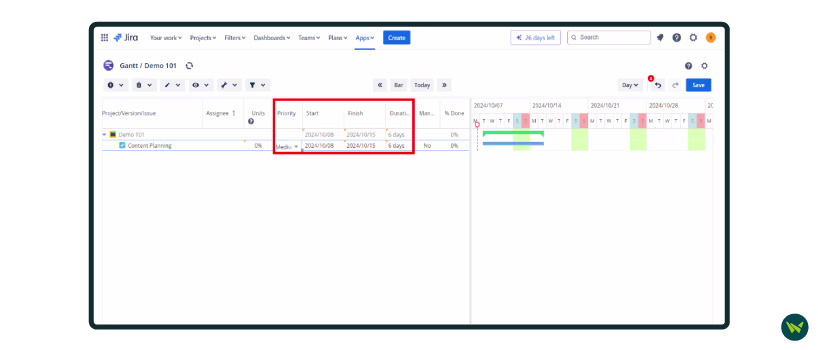
Step 5. Now you have access to the Gantt chart view via WBS Gantt-Chart plugin.
Step 6. Click on the ‘+’ icon and start adding ‘Task’ in your Jira Gantt chart.
Step 7. After the task is added in the Gantt chart view, you can change the priority of the task, as well as duration, by setting the starting, and the ending date
Step 8. Keep adding the relevant tasks to the Gantt chart for a complete bird’s-eye view of the tasks at hand.
Benefits From Using WBS Gantt-Chart
While the basic functionality remains the same, these plugins differ:
- Structure.Gantt integrates existing Jira data for flexible scheduling and detailed resource management
- BigGantt emphasizes task hierarchy with robust drag-and-drop functionality and comprehensive milestone tracking
- WBS Gantt-Chart focuses on detailed task breakdowns and complex dependency management, allowing for manual scheduling of tasks
Managing projects can be incredibly challenging. With multiple teams, various tasks, and stakeholders' expectations to consider, ensuring everything stays on track and within budget is no easy feat. This is where Jira Gantt charts come in handy, giving project managers a clear view of tasks, resources, and the project timeline's unfolding.
Visualize Your Project Timeline
While Jira provides a solid foundation for project management, it lacks native Gantt chart functionality. Fortunately, this gap can be filled with various third-party plugins that seamlessly integrate with Jira. Tools like BigGantt, Structure.Gantt, and WBS Gantt-Chart empower you to visualize your project timelines, manage task dependencies, and create comprehensive plans—all within the familiar Jira interface.
By leveraging these powerful tools, you enhance your team’s ability to collaborate effectively and stay on track. As you implement Gantt charts in your workflow, you'll discover new levels of clarity and control that drive your projects toward success. Embrace these integrations to elevate your project management experience in Jira.
Please visit our project management resources center section for further assistance.