


Amplitude Analytics
Last Updated
Key Takeaways
Generated from the text of customer reviews
Amplitude Analytics is a cloud-based product analytics platform that unifies user journey tracking and event data. Product managers and marketers in the B2B and e-commerce sectors benefit most from it. Users praise its dashboard customization for cross-platform analytics, though setup configuration presents a steep learning curve. Recent updates expand AI agents and MCP servers for direct querying within AI workflows.
Our Verdict
Amplitude Analytics provides strong value for mid-market to enterprise digital firms needing deep user journey insights across cross-functional teams. Its broad use cases make it relevant for acquisition, retention, and monetization teams. Its scalable pricing model is favorable for growing teams because of its generous free tier. We recommend it for scaling product teams prioritizing behavior-based product decisions.
Overall Rating
Based on 19 users reviews
4.7
Rating Distribution
Positive
100%
Neutral
0%
Negative
0%
Starting Price
$45
per month
Amplitude Analytics Specifications
- Reporting
- Dashboard
- Time Tracking
- Task Management
What Is Amplitude Analytics?
Amplitude Analytics is a digital analytics platform tailored for teams seeking deeper visibility into user behavior and product engagement. By combining funnel analysis and session replays, the platform helps assess where users abandon the product while evaluating returning behavior. Cross-functional collaboration further strengthens the process by providing real-time data access, so teams can make confident decisions by studying underlying patterns. This unified data infrastructure enables organizations to identify engagement trends and improve customer retention by optimizing user journeys.
What Is Amplitude Analytics Best For?
Amplitude Analytics is widely known for building cohorts, which simplify grouping users based on shared properties or actions. Teams can reuse the segment across multiple charts and dashboards to monitor performance changes in lookalike audiences over time to measure metric variations and track growth trends. This focused analytical approach helps marketing executives assess top-performing campaigns and channels based on user behavior.
How Much Does Amplitude Analytics Cost?
Amplitude Analytics pricing starts at $45/month for the Plus plan, which includes product analytics, feature flags, session replay, and AI capabilities. Its pricing increases as event volume grows. The platform also offers the following plans:
- Free: 2M events/month
- Growth: Custom pricing
- Enterprise: Custom pricing
Besides the base price, users should consider the following additional elements for budgeting purposes:
- Guides And Surveys Add-On: ~$10,000–$20,000/year — Amplitude Plus offers Guides and Surveys as a paid add-on, with 10 guides and 5 surveys included
- Implementation And Event Tracking Setup: $2,000–$15,000 — Covers event taxonomy planning, SDK implementation, tracking configuration, user identification, and data validation
- Data Integration And Warehouse Connectivity: $1,000–$10,000 — Includes connections with data warehouses, CDPs, CRM systems, marketing platforms, and other data sources
- Experimentation And Feature Flag Setup: $2,000–$12,000 — Considered when A/B test configuration, feature flag deployment, audience targeting, and experiment measurement is required
- Ongoing Analytics Governance And Support: $500–$5,000/month — Based on event governance, tracking-plan maintenance, data-quality monitoring, dashboard management, and analytics optimization
Disclaimer: The pricing is subject to change.
Amplitude Analytics Integrations
Amplitude Analytics integrates with many invaluable third-party platforms, including:
How Does Amplitude Analytics Work?
Here is a general workflow for getting started with the platform:
- Log in to the Amplitude Analytics dashboard to access the central data control panel
- Configure user event tracking to capture clicks, page views, and custom product actions
- Analyze user journeys using session replay tools to identify drop-off points
- Build behavioral cohorts by selecting specific user properties and engagement filters
- Launch feature experiments to engage users directly within the product
- Monitor performance metrics across unified dashboards to track conversion rates
- Compare user segments to identify differences in activity or outcomes
Who Is Amplitude Analytics For?
It is suitable for a range of industries including:
- Media
- Gaming
- Integrated telecommunications
- Financial
- E-commerce
- Healthcare
Amplitude Analytics Use Cases
Based on our analysis of user feedback and Amplitude Analytics current capabilities, we have identified key scenarios where this software is a good fit for digital product and marketing teams:
Product Teams Identifying Where Users Drop Off In Onboarding
A growing SaaS company launching a new onboarding flow often cannot tell where users lose interest because event logs sit in separate developer tools. Amplitude Analytics solves this using the funnel analysis tool to map multi-step conversion funnels and pinpoint exact drop-off points by user segment. The funnel charts help teams quickly adjust onboarding steps to lift user conversion rates.
Marketing Teams Measuring Content Impact On User Conversion
Marketing teams publishing educational content struggle to prove which specific articles drive paid signups versus passive traffic. Amplitude Analytics addresses this by offering the attribution modeling feature to connect content page views directly to business KPI outcomes and paid conversions. Marketers evaluate true channel impact and allocate budget toward high-performing content with verified ROI.
Customer Success Teams Tracking Long-Term User Retention
A subscription platform noticing a sudden spike in cancellations lacks visibility into which product behaviors drive long-term customer loyalty. Amplitude Analytics resolves this using the behavioral cohorts feature to group users by shared actions and track their activity over several months. The cohorts allow managers to compare engaged segments against churned users to spot early warning signs and prevent cancellations.
Engineering Teams Evaluating High-Value Feature Monetization
An app team introducing premium paid features struggles to identify which user interactions lead directly to upgrades. Amplitude Analytics solves this using the revenue analysis tool to map specific behavioral triggers against total transaction value across user accounts. The analytic insights empower product managers to target high-intent behaviors, optimizing feature placement and accelerating revenue growth.
Is Amplitude Analytics Right For You?
Organizations struggling to understand how digital products influence user behavior and business outcomes may deal with low conversions. Amplitude Analytics helps teams turn customer data into measurable insights. The platform utilizes behavioral reports to understand users' interactions with products while converting raw logs into self-service behavioral cohorts to understand downstream metrics. Delivering real-time insights, this SOC II-compliant platform helps leading product and marketing teams at firms like Cisco Systems identify friction points and refine product strategies.
Not sure about Amplitude Analytics? For additional assistance, please contact our support team at (661) 384-7070.
Amplitude Analytics Features
Funnel Analytics
Funnel analytics by Amplitude Analytics software allows marketing executives to examine how users navigate through a defined sequence of events. These charts visualize multi-step user journeys to identify where users abandon a process to understand conversion bottlenecks. As a result, marketing teams can investigate friction in workflows to optimize onboarding.
Retention Analytics
Retention analytics charts allow organizations to measure how often users return to a product over specified time periods. By utilizing usage intervals to reveal specific triggers across different customer segments, teams can identify patterns that signal churn risks before cancellations happen. This way, the analysis encourages teams to enhance product adoption.
Account Level Reporting
Account level reporting enables B2B teams to analyze usage metrics aggregated across groups rather than individual users. This capability helps account managers monitor company-wide adoption rates and platform health. Consequently, customer success teams can identify expansion opportunities and mitigate churn risks at the account level.
User Sessions
Amplitude Analytics features user session analysis that records individual user interactions and engagement frequency throughout the digital product lifecycle. The session provides teams visibility into how much time customers spend interacting with products and how frequently they do so. Moreover, breaking out users into groups helps understand daily active usage without manual data aggregation.
Dashboard Management
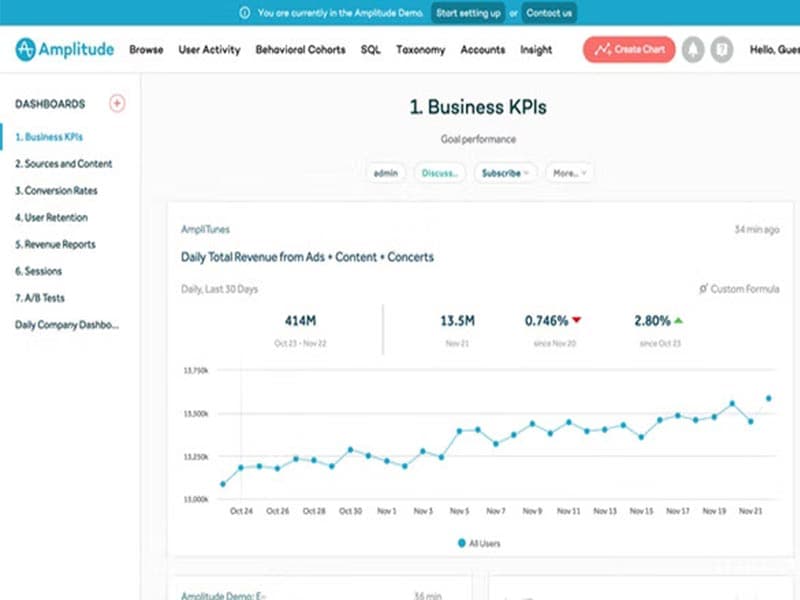
The platform offers a visual dashboard that displays multiple charts on a single page so teams can monitor desired metrics side-by-side. With this tool, project managers can compare multiple project charts simultaneously to cross-analyze KPIs. They can also set filters, time ranges, and comparisons for recurring reviews, and schedule automated dashboard snapshots directly to Email or Slack for real-time performance updates.
Pros And Cons of Amplitude Analytics
Pros
Session replay visualization uncovers exact user friction points
Multi-channel integration unifies data sources across teams
Anomaly detection can draw attention to unexpected metric changes
Flexible reporting reduces dependence on separate analytical requests
Automated event tracking cuts manual data gathering time for product analysts
Cons
The event segmentation demands careful planning
Steep learning curve for advanced queries requires dedicated team training
Dashboard builder should include detailed onboarding tips
Amplitude Analytics Pricing
Free | Plus | Growth | Enterprise |
|---|---|---|---|
Free Forever | Starts at: $0 | Custom pricing | Custom pricing |
|
|
|
|
Disclaimer: The pricing details were last updated on Oct 09, 2026 from the vendor's website. Please contact us for a tailored pricing list.
Amplitude Analytics Reviews
Total 19 reviews
4.7
All reviews are from verified customers
Rating Distribution
5
Stars74%
4
Stars26%
3
Stars0%
2
Stars0%
1
Stars0%
Share your experience
Information Technology and Services, 51-100 employees
“The optimal answer to all your web analytics problems”
Pros
Helped me getting valuable insights into user activity, collecting useful data for marketing and sales. Also, I was able to generate various reports, real-time information.
Cons
Long loading time, complex custom report creation, and it does not have a very user-friendly interface.
Rating Distribution
Ease of use
10
Value for money
10
Customer Support
10
Functionality
10
Internet, 11-50 employees
“Best product analytics tool”
Pros
Powerful and easy-to-use analytics tool, replaces other analytics tools, great functionality.
Cons
New users may find it challenging to learn.
Rating Distribution
Ease of use
10
Value for money
10
Customer Support
10
Functionality
10
Food & Beverages, 500+ employees
“It provides real-time analytics that help the organization improve its marketing strategy.”
Pros
The software provides access to visualizations and insights, simplifies data collection and analysis.
Cons
Steep learning curve.
Rating Distribution
Ease of use
10
Value for money
10
Customer Support
10
Functionality
10
Frequently Asked Questions
Does Amplitude Analytics offer an API?
Yes, the software offers APIs for data streaming, behavioral cohorts, and event segmentation.
Does Amplitude Analytics have a mobile app?
No, it does not offer a mobile app.
What language does Amplitude Analytics support?
Amplitude Analytics is primarily available in English, Japanese, Spanish, French, Portuguese, Chinese, and Arabic.
What types of pricing plans does Amplitude Analytics offer?
Amplitude Analytics offers a free plan, a Plus plan starting at $45/month, and custom Growth and Enterprise plans. Request a personalized price quote for your business today.
What other apps does Amplitude Analytics integrate with?
Amplitude Analytics integrates with Claude, Notion, Slack, and Mira.
Who are the typical users of Amplitude Analytics?
It is trusted by professionals across financial services, healthcare, media, SaaS, and B2B sectors.
What level of support does Amplitude Analytics offer?
Amplitude Analytics offers a help center, developer hub, academy training, dedicated customer support, and an account manager.